
Free trading journal spreadsheet template (Google Sheets + Excel)
A free trading journal template with an expectancy-by-setup tab, a pre-trade checklist that gates entries, and a weekly review prompt. Copy, paste, start logging.
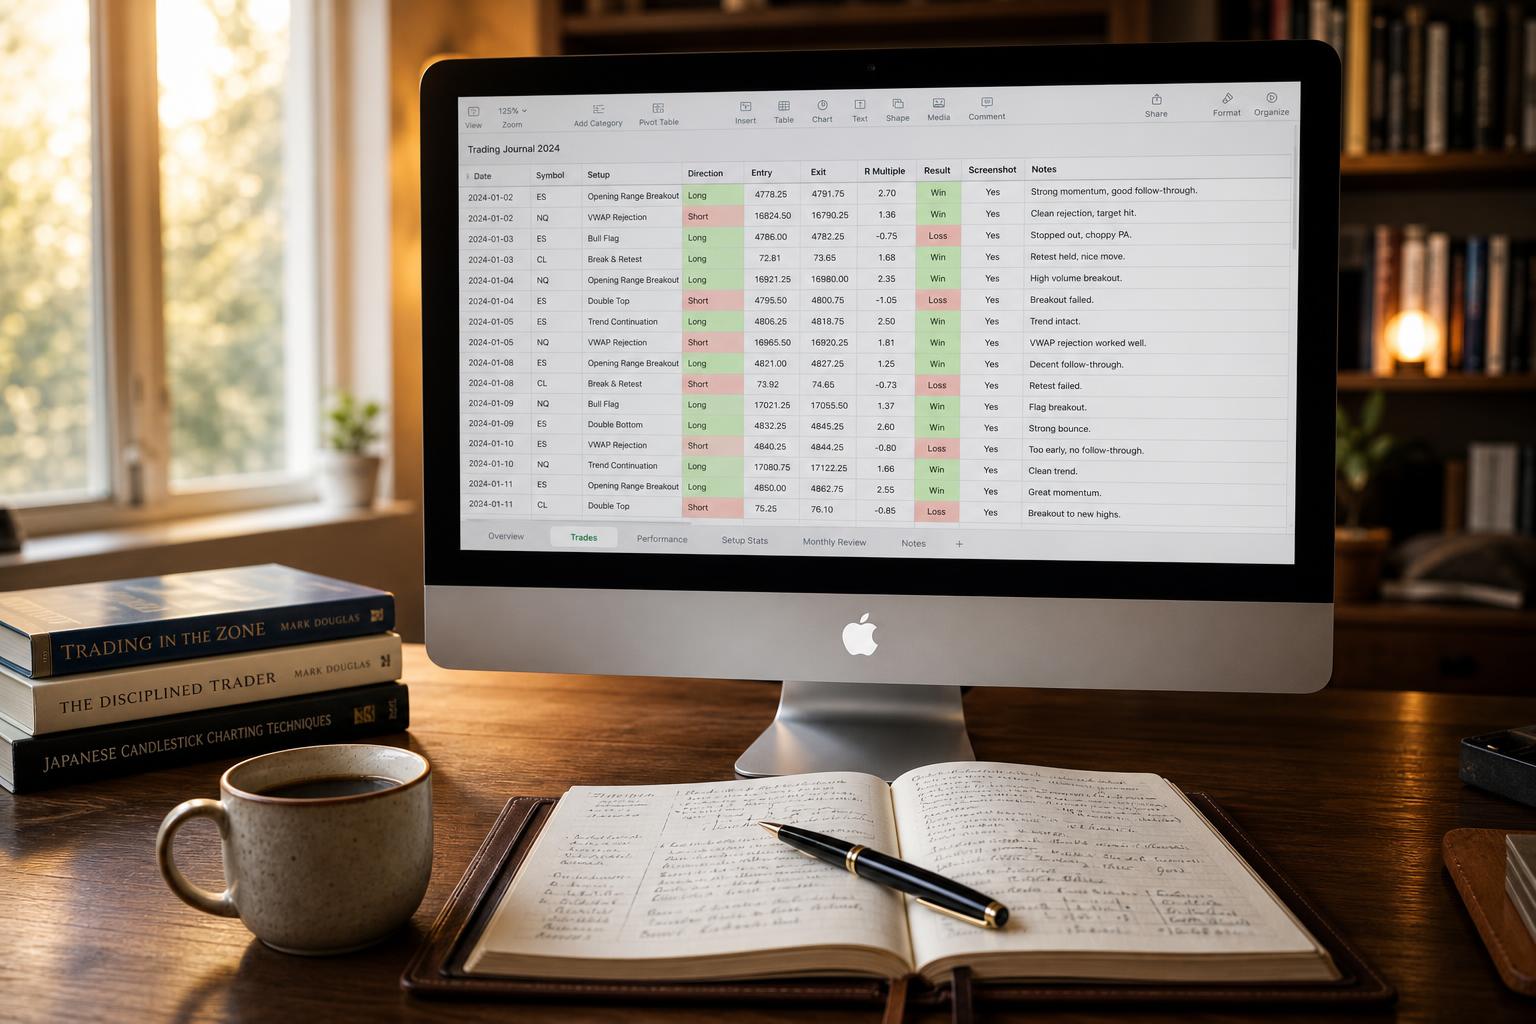
Most "free trading journal templates" are just a row of column headers in a coloured sheet. That is not a journal, that is a list. A journal is a system that tells you, every week, which setup is paying you, where your discipline is leaking, and what to change next. This page gives you that system in three small parts you can drop into Google Sheets or Excel today.
If you want the full column-by-column build (date format, dropdowns, R-multiple math), read the companion guide first: How to build a trading journal in Google Sheets. This article assumes you already have a Trades tab and shows you the three tabs that turn it into a feedback loop.
What's already in the template
A Trades tab with the standard 14 columns: date, symbol, direction, setup tag, entry, stop, target, exit, size, R-multiple, net PnL, emotion 1–5, plan followed Y/N, notes. Two columns do most of the work: setup tag and plan followed, bolded because the rest of this article is built on them.
Tab 1, Expectancy by setup
This is the tab the other 95% of templates skip, and it is the one that pays for itself. The headline number ("win rate 58%") tells you almost nothing. The number you need is expectancy per setup, in R.
Set up one row per setup tag, with these four columns pulled from your Trades tab:
| Metric | Formula (assumes setup tag in column D, R in column J) |
|---|---|
| Trades | =COUNTIF(Trades!D:D, A2) |
| Win rate | =COUNTIFS(Trades!D:D, A2, Trades!J:J, ">0") / COUNTIF(Trades!D:D, A2) |
| Average R | =AVERAGEIF(Trades!D:D, A2, Trades!J:J) |
| Expectancy (R) | =AVERAGEIFS(Trades!J:J, Trades!D:D, A2, Trades!J:J, ">0") * WinRate + AVERAGEIFS(Trades!J:J, Trades!D:D, A2, Trades!J:J, "<0") * (1 - WinRate) |
A worked example after 60 trades:
| Setup tag | Trades | Win rate | Avg R | Expectancy |
|---|---|---|---|---|
| LCC reclaim | 32 | 56% | +0.62 | +0.58R |
| News break | 14 | 50% | +0.10 | +0.05R |
| Counter-trend fade | 14 | 36% | −0.20 | −0.22R |
The verdict writes itself: LCC reclaim is the business, news break is noise, counter-trend fade is paying to play. Cutting one losing setup is usually a bigger edge than any indicator you'll ever add.
Tab 2, Pre-trade checklist (gates entries, not just records them)
Most journals log what happened. This row decides whether the trade happens at all. Add three cells you fill before clicking buy:
- Setup criteria met? Y / N
- Risk pre-defined (stop on the chart)? Y / N
- Acceptable session / news window? Y / N
Then a fourth cell: =IF(COUNTIF(B2:D2,"N")=0, "TAKE", "SKIP"). If it says SKIP, the trade does not get taken, there is nothing to log because there is nothing to do. Run this for two weeks. The number of "SKIP" rows is the number of mistakes you didn't make.
This is the single behaviour change a spreadsheet can drive that a fancier tool can't drive better. It is also the reason the plan-followed Y/N column on the Trades tab matters: it lets you compare expectancy on plan-followed trades vs off-plan trades. The gap is usually embarrassing.
Tab 3, Weekly review (six prompts and one leak)
Friday after the close, fill six cells. That is the entire review.
| Prompt | What goes in the cell |
|---|---|
| Trades this week | =COUNTIFS(Trades!A:A, ">="&TODAY()-6, Trades!A:A, "<="&TODAY()) |
| Plan-followed rate | =COUNTIFS(Trades!M:M, "Y", Trades!A:A, ">="&TODAY()-6) / COUNTIFS(Trades!A:A, ">="&TODAY()-6) |
| Best setup this week | Highest-expectancy setup from Tab 1, filtered to last 7 days |
| Worst setup this week | Lowest-expectancy setup, same filter |
| Biggest emotional moment | One sentence. The trade you'd un-take if you could |
| The leak, one thing to change next week | One sentence. Not a goal, a change |
That last cell is the whole point. Six weeks of "the leak" cells in a column is the most valuable document you'll ever own as a trader. Not because the answers are clever, because the pattern across them tells you what you actually keep doing wrong.
How this template differs from the column-list versions
Most free templates stop at the Trades tab. They give you the data. This one adds the system: expectancy-by-setup so you know what to cut, a checklist so you skip the trades that shouldn't exist, and a weekly leak cell so you compound corrections instead of repeating them. Same 14 columns underneath, completely different output.
When the spreadsheet stops being enough
A sheet is the right starting point. It breaks in three predictable places:
- Friction. Logging eight trades on a busy day in a sheet hurts. You skip a day, then a week, then the journal is dead.
- No memory across weeks. The leak cell helps, but a spreadsheet won't surface "you skipped your checklist on every losing trade for three weeks", that pattern needs a system that watches your history for you.
- No coaching loop. Stats answer the questions you already thought to ask. The hard part is asking the right one.
That is the gap Create Impacts closes: the same setup-tag analytics and checklist gate, but with broker auto-import, the checklist firing before every entry, an emotion tracker that flags tilt early, and a weekly review that points at the leak you didn't see.
Want a head start?
If you'd rather skip the formula setup, our free Starter Pack ships this template as a printable PDF: trades layout, setup-tag cheat sheet, pre-trade checklist, weekly review prompts. No credit card, delivered to your inbox.
The rule is the same whether you stay in a spreadsheet or graduate to a tool: log every trade, score the plan, review weekly, cut the worst setup. That loop is the edge. Everything else is decoration.
Track your discipline, not just your P&L
Create Impacts is the trading journal for serious traders. 14-day free trial, no credit card.
Start free trial